CLIMATECH INNOVATIONS INC
Led a team to define MVP scope, prioritize features, and deliver a build-ready design in a 4 week timeline.
UX Design
SaaS
Dashboard


In Progress
This case study is currently being updated. Some sections and visuals are in progress but still show the overall design process and outcomes.


problem

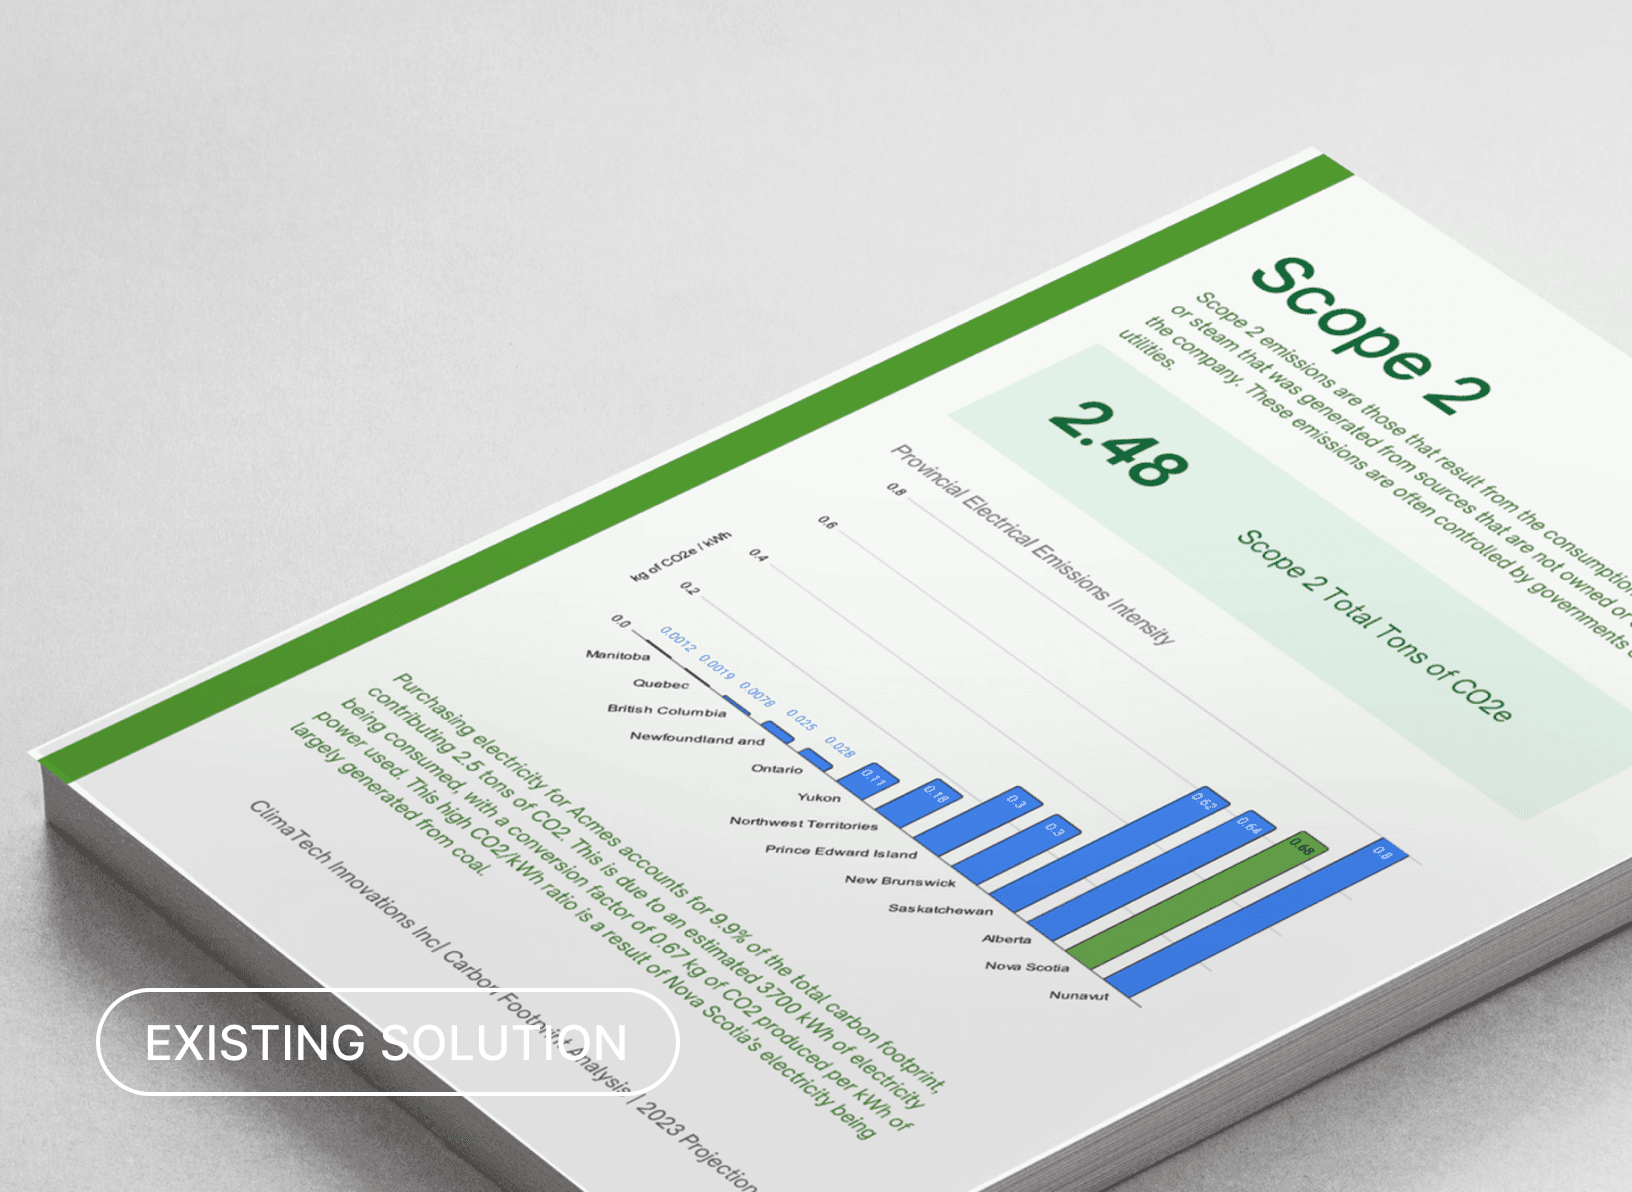
Problems with the current physical solution…
⭐️ challenge
business goals
Deliver a minimum viable produce (MVP) ClimaTech can use in marketing campaigns to bring in new business.
Highlight investing in forest preservation and restoration services through ClimaTech as a way for businesses to offset their carbon emissions.
exploration
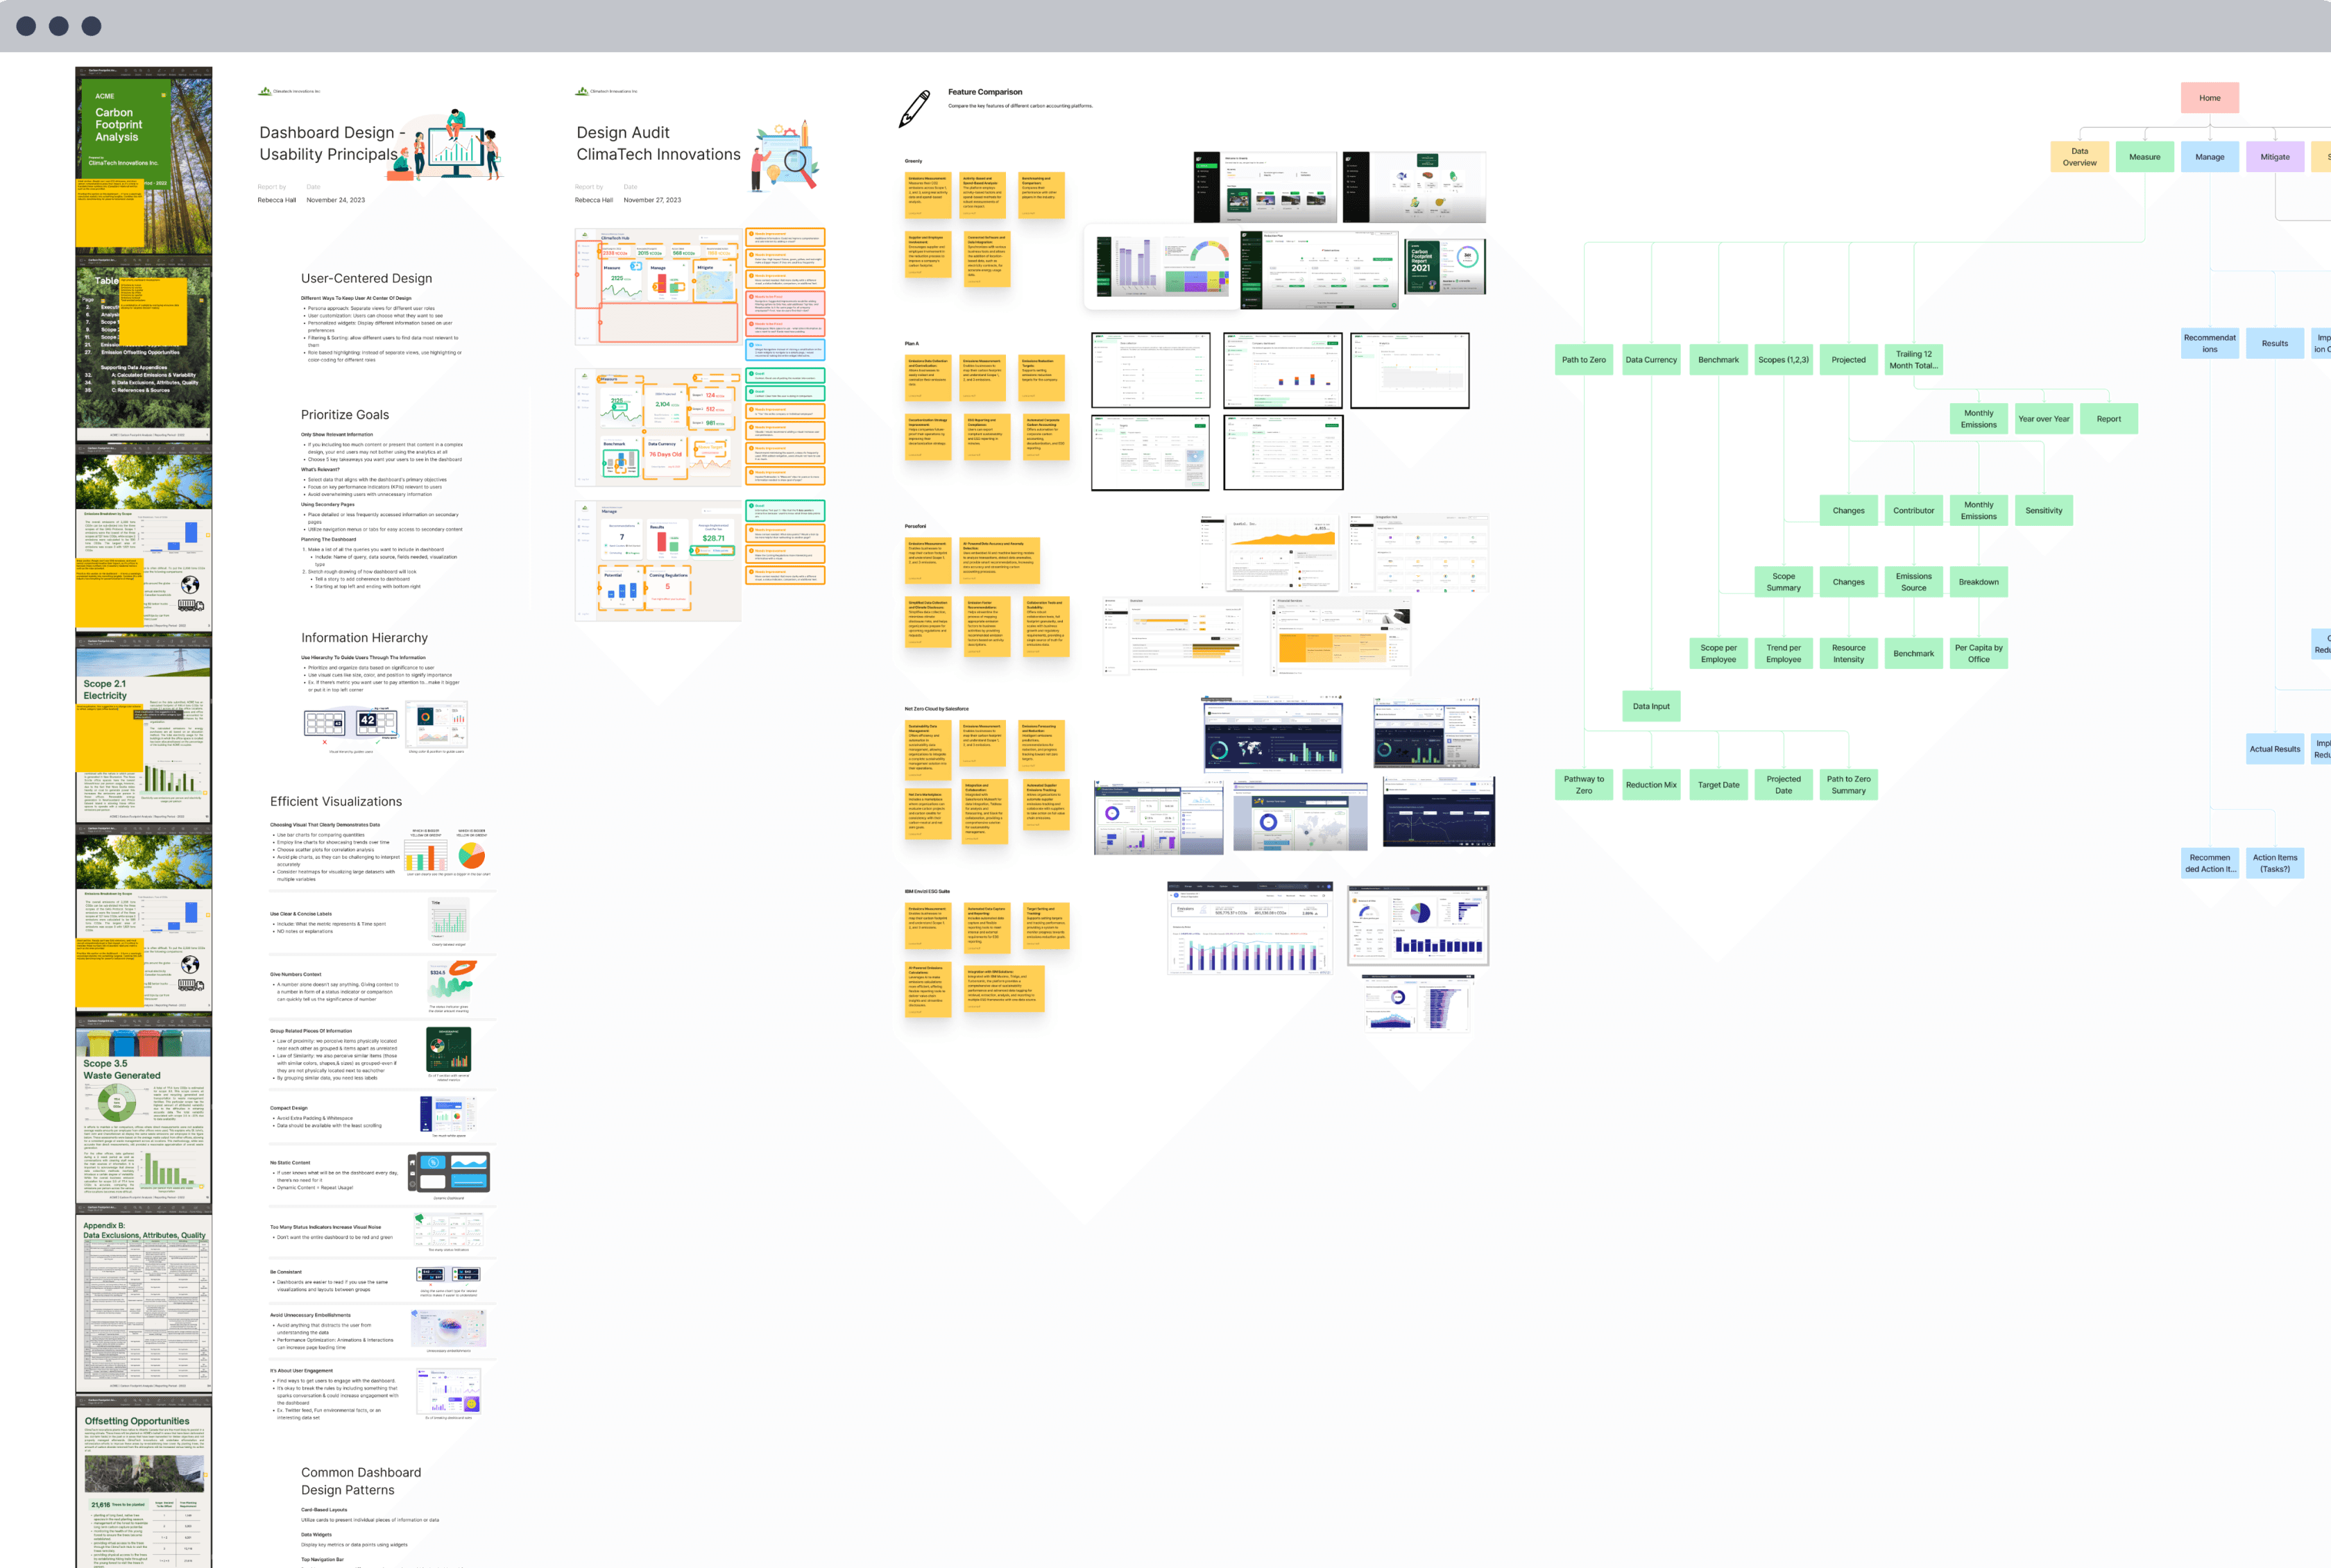
Research conducted
Stakeholder interviews
Competitive analysis
Data visualization usability principals
Audit of ClimaTech’s Carbon Footprint Analysis report
Audit of ClimaTech’s digital mockups
Stakeholder interviews
We interviewed ClimaTech's founders to understand who their users are, along with their business and product goals, informing the project scope and uncovering a key selling point; the opportunity for users to offset carbon emissions by purchasing trees through ClimaTech.
Major research takeaway
Competitor solutions were overly complicated
User’s subject knowledge ranged from novice to expert
ClimaTech’s current report doesn’t included clear steps to reducing carbon footprint
Early ClimaTech mockups had no user journey, just an overload of data widgets.
audience

Sustainability Manager
"I oversee our company's efforts to measure, reduce, and report our carbon footprint."
USER goals
Now that I had a better understanding of who the user was and the problem that needed to be solved, I defined our user goals and user actions for our key screens.
What are our user's goals?
brainstorming solution ideas

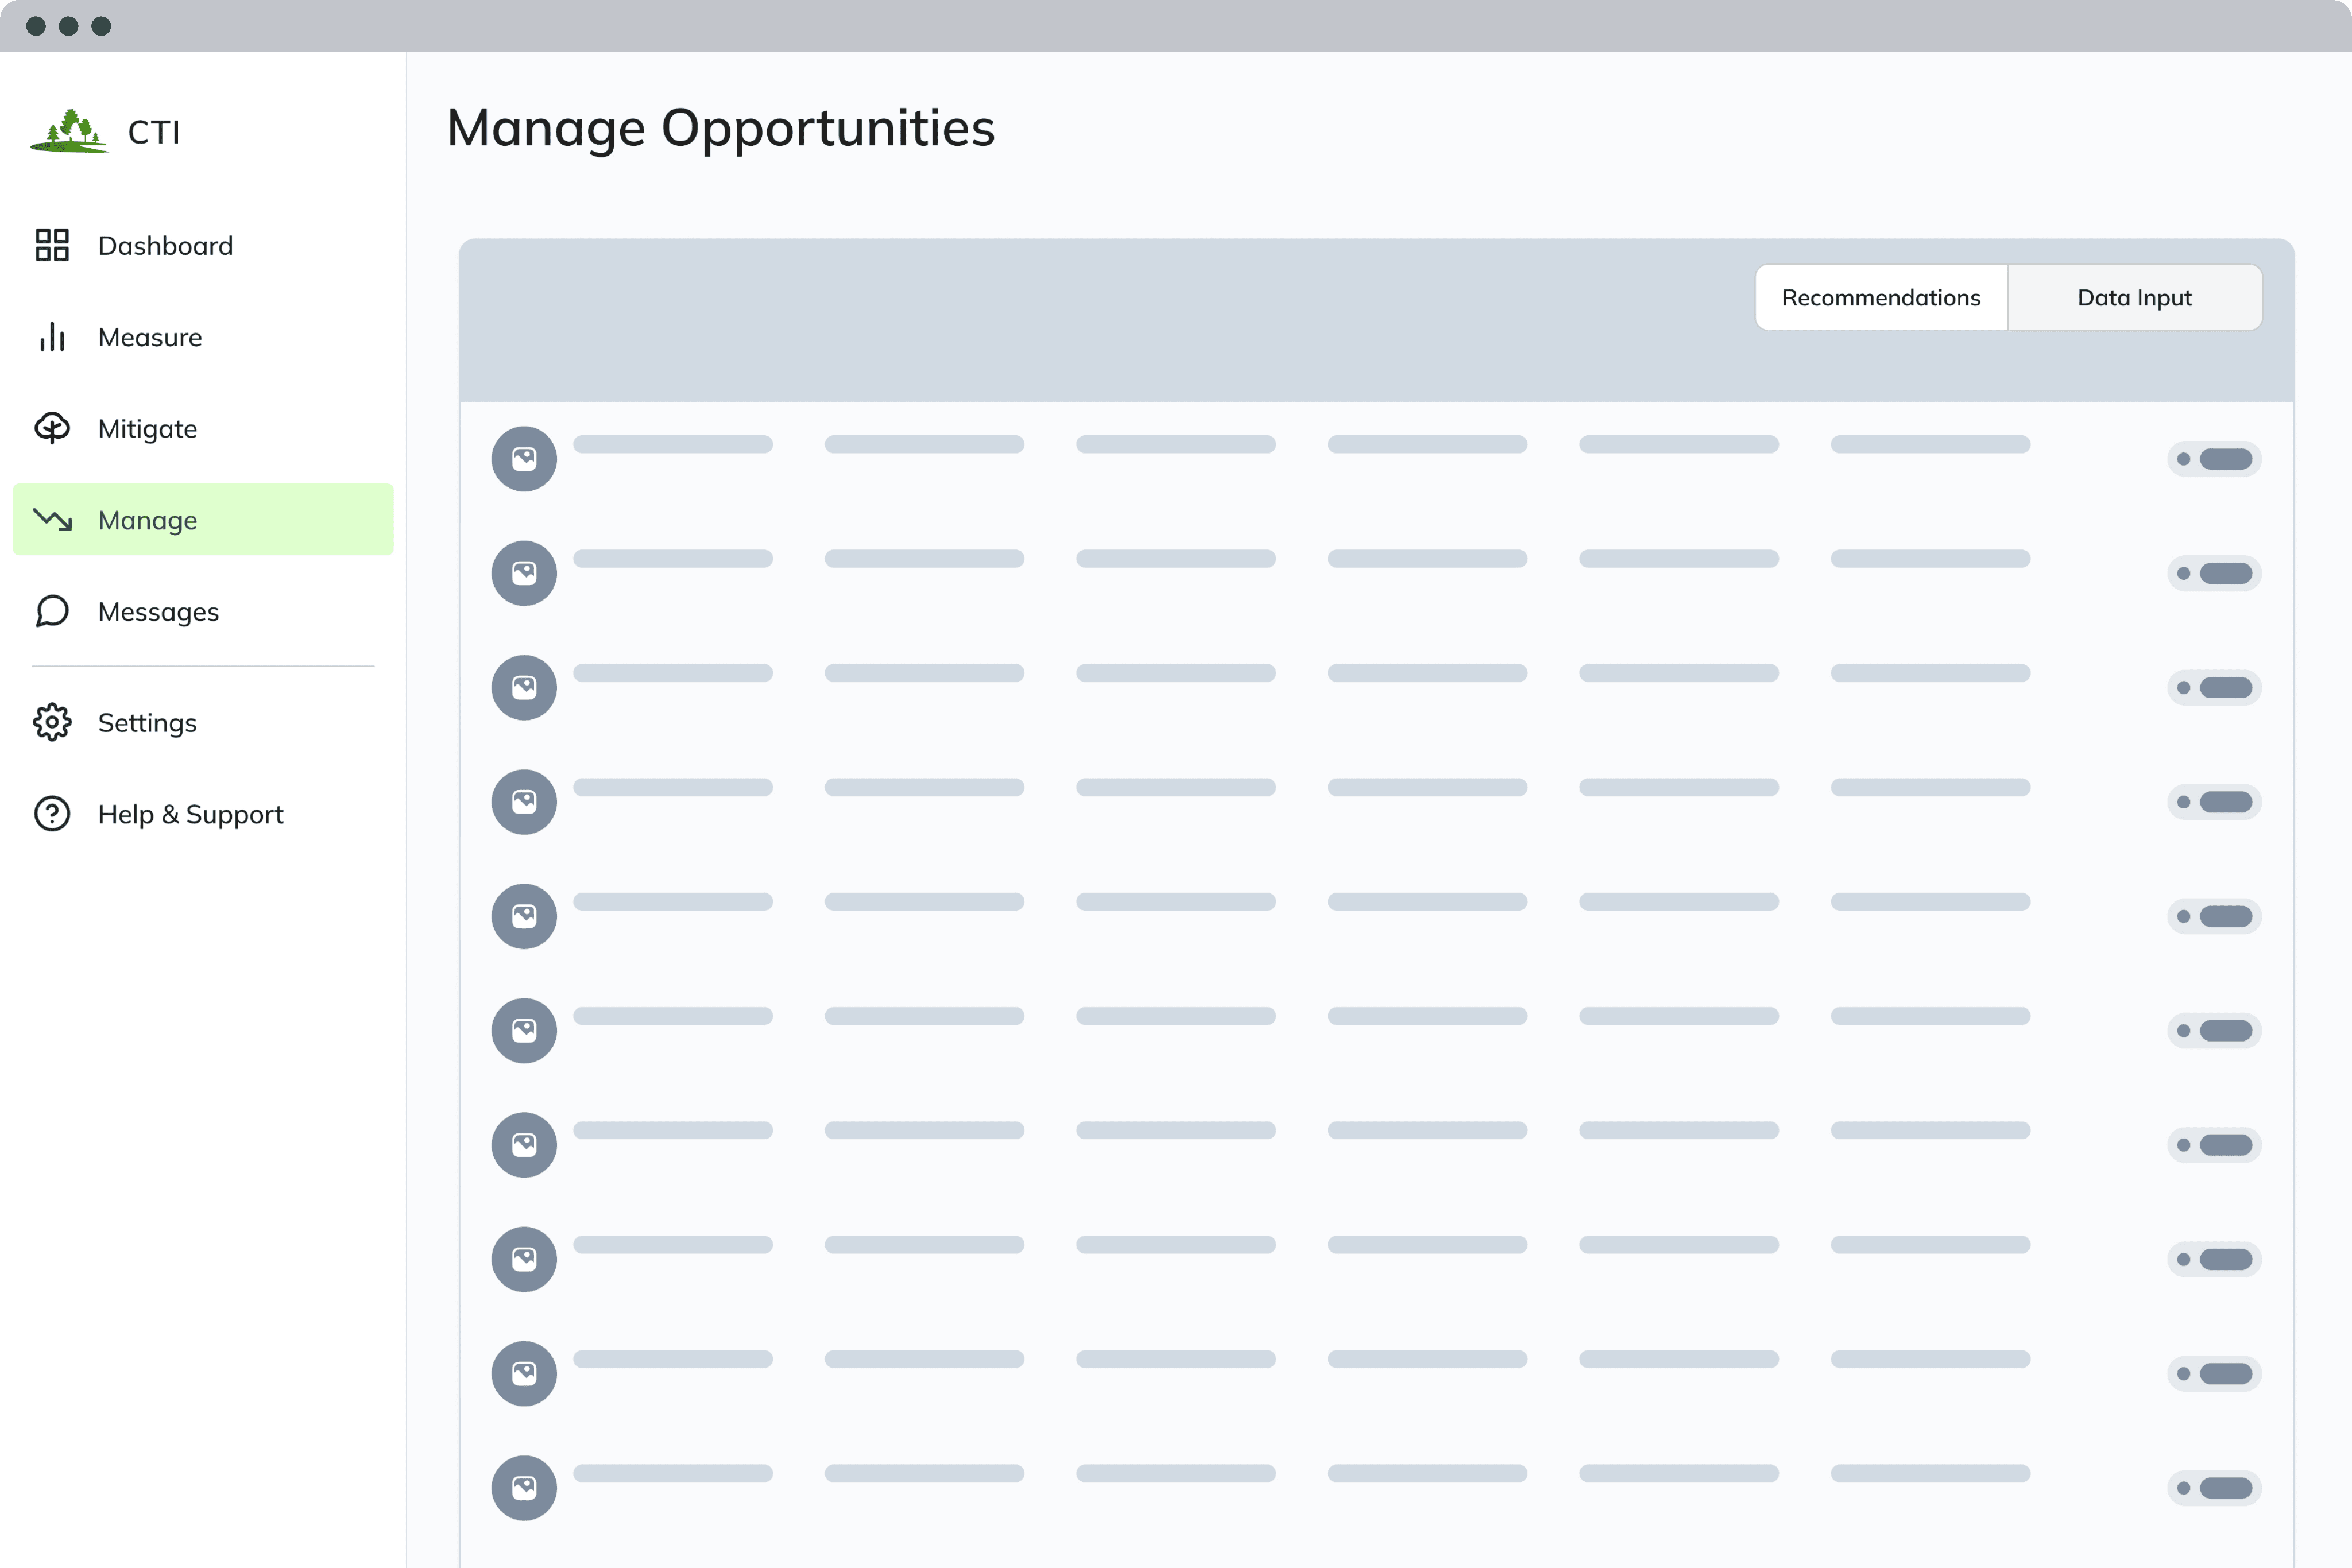
To be sure my solution concept was inline with the business goals, I created a quick wireframe mockup of the main screens to present to the founders. Their feedback gave me some claity I needed before moving to the high fidelity mockup.
usability testing

Usability Testing Results
solution

How can I quickly understand my company's carbon footprint & how to reduce it?
Sustainability Manager
Main user flows
User Flow
Understand
Open Dashboard.
View "Total Carbon Footprint" chart by year. Allows user to quickly se the company's progress.
Basic Understanding: View Dashboard chart & hover over important statistics.
Deep Understanding: Interact with chart + clicks into chart to visit Measure Page to view carbon footprint details.
User Flow
Reduce
Open Dashboard.
View reduction options in Manage Section.
View offsetting options in Mitigate Section.
View available plots to purchase through ClimaTech.
See updates reflected in totoal carbon footprint.
Validating the design
Some positive outcomes
The simplified dashboard made it easy for users to understand their carbon footprint
Users understood the choices to offset or reduce their carbon footprint
Users appreciated the suggestions on the dashboard
Users liked seeing prices and cost savings under the reduction opportunities
iterations
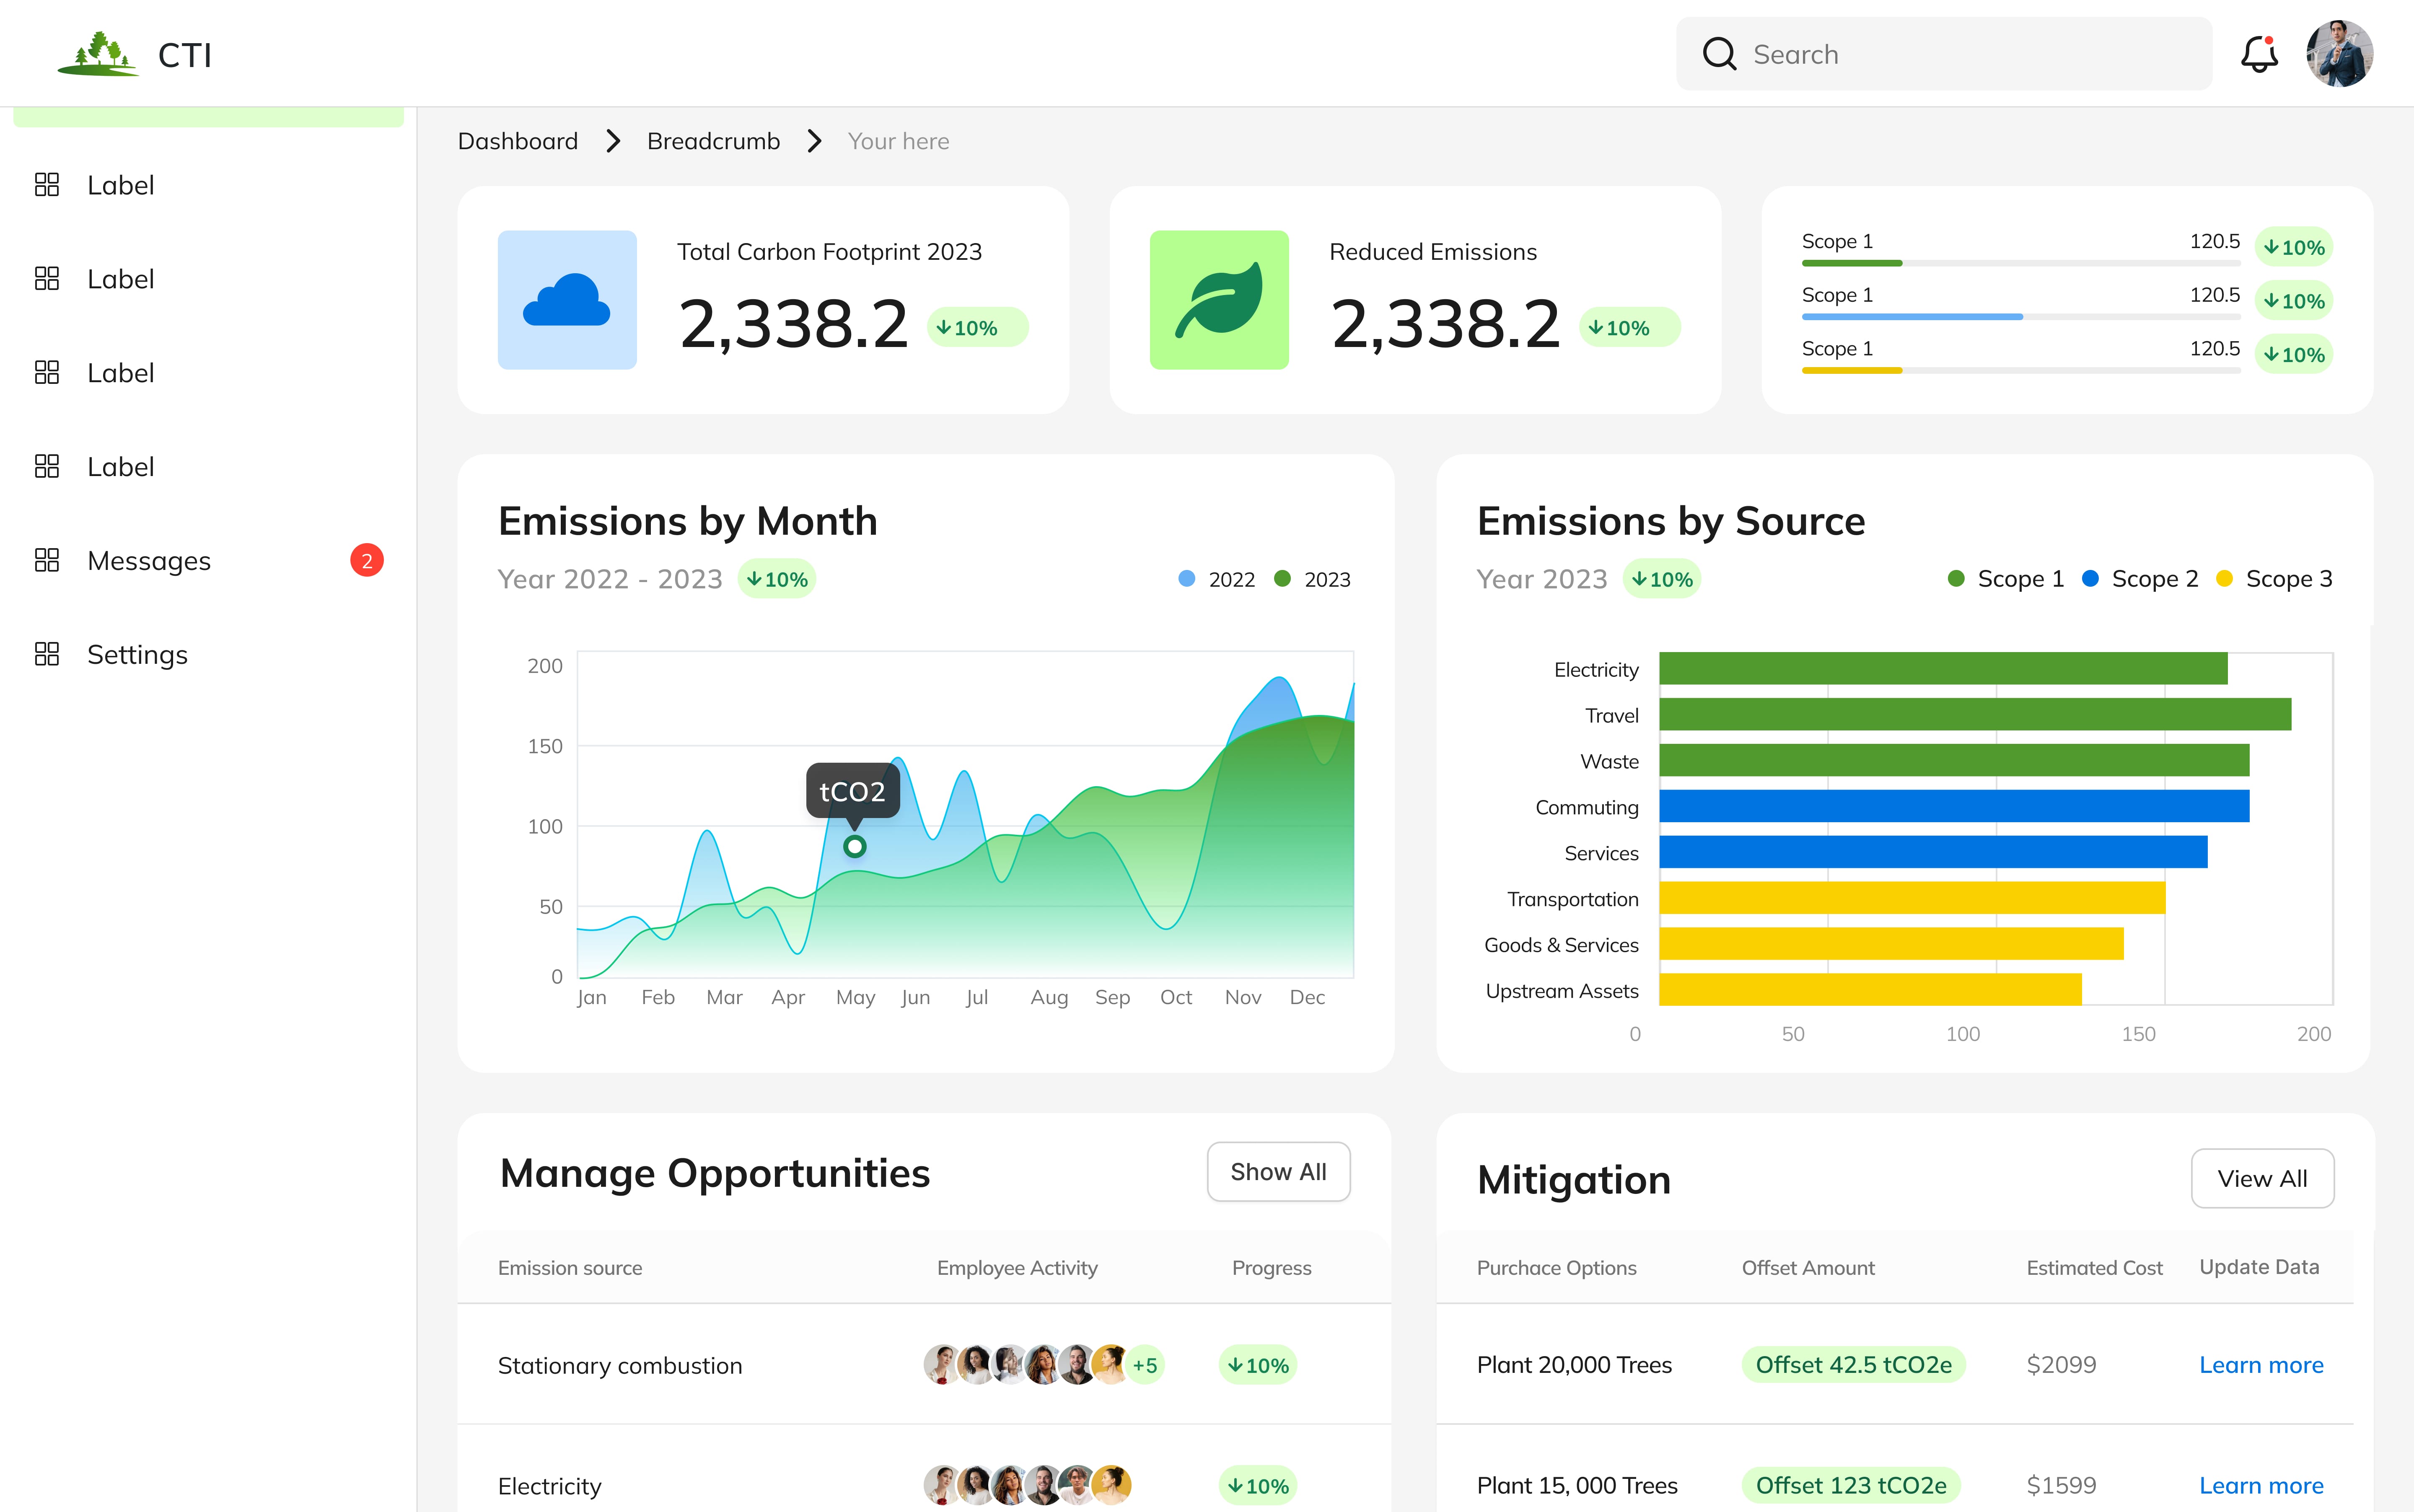
Problem: Dashboard Charts
Multiple charts made it harder for users to understand their carbon footprint.
Problem: Using the Dashboard
Unclear directions confused users in reducing and offsetting sections
Solution 1
Created 1 main chart for Dashboard making it easier for users to understand their current carbon footprint.

Solution 2
Created a separate page for detailed charts available for users who wanted more data.

style guide
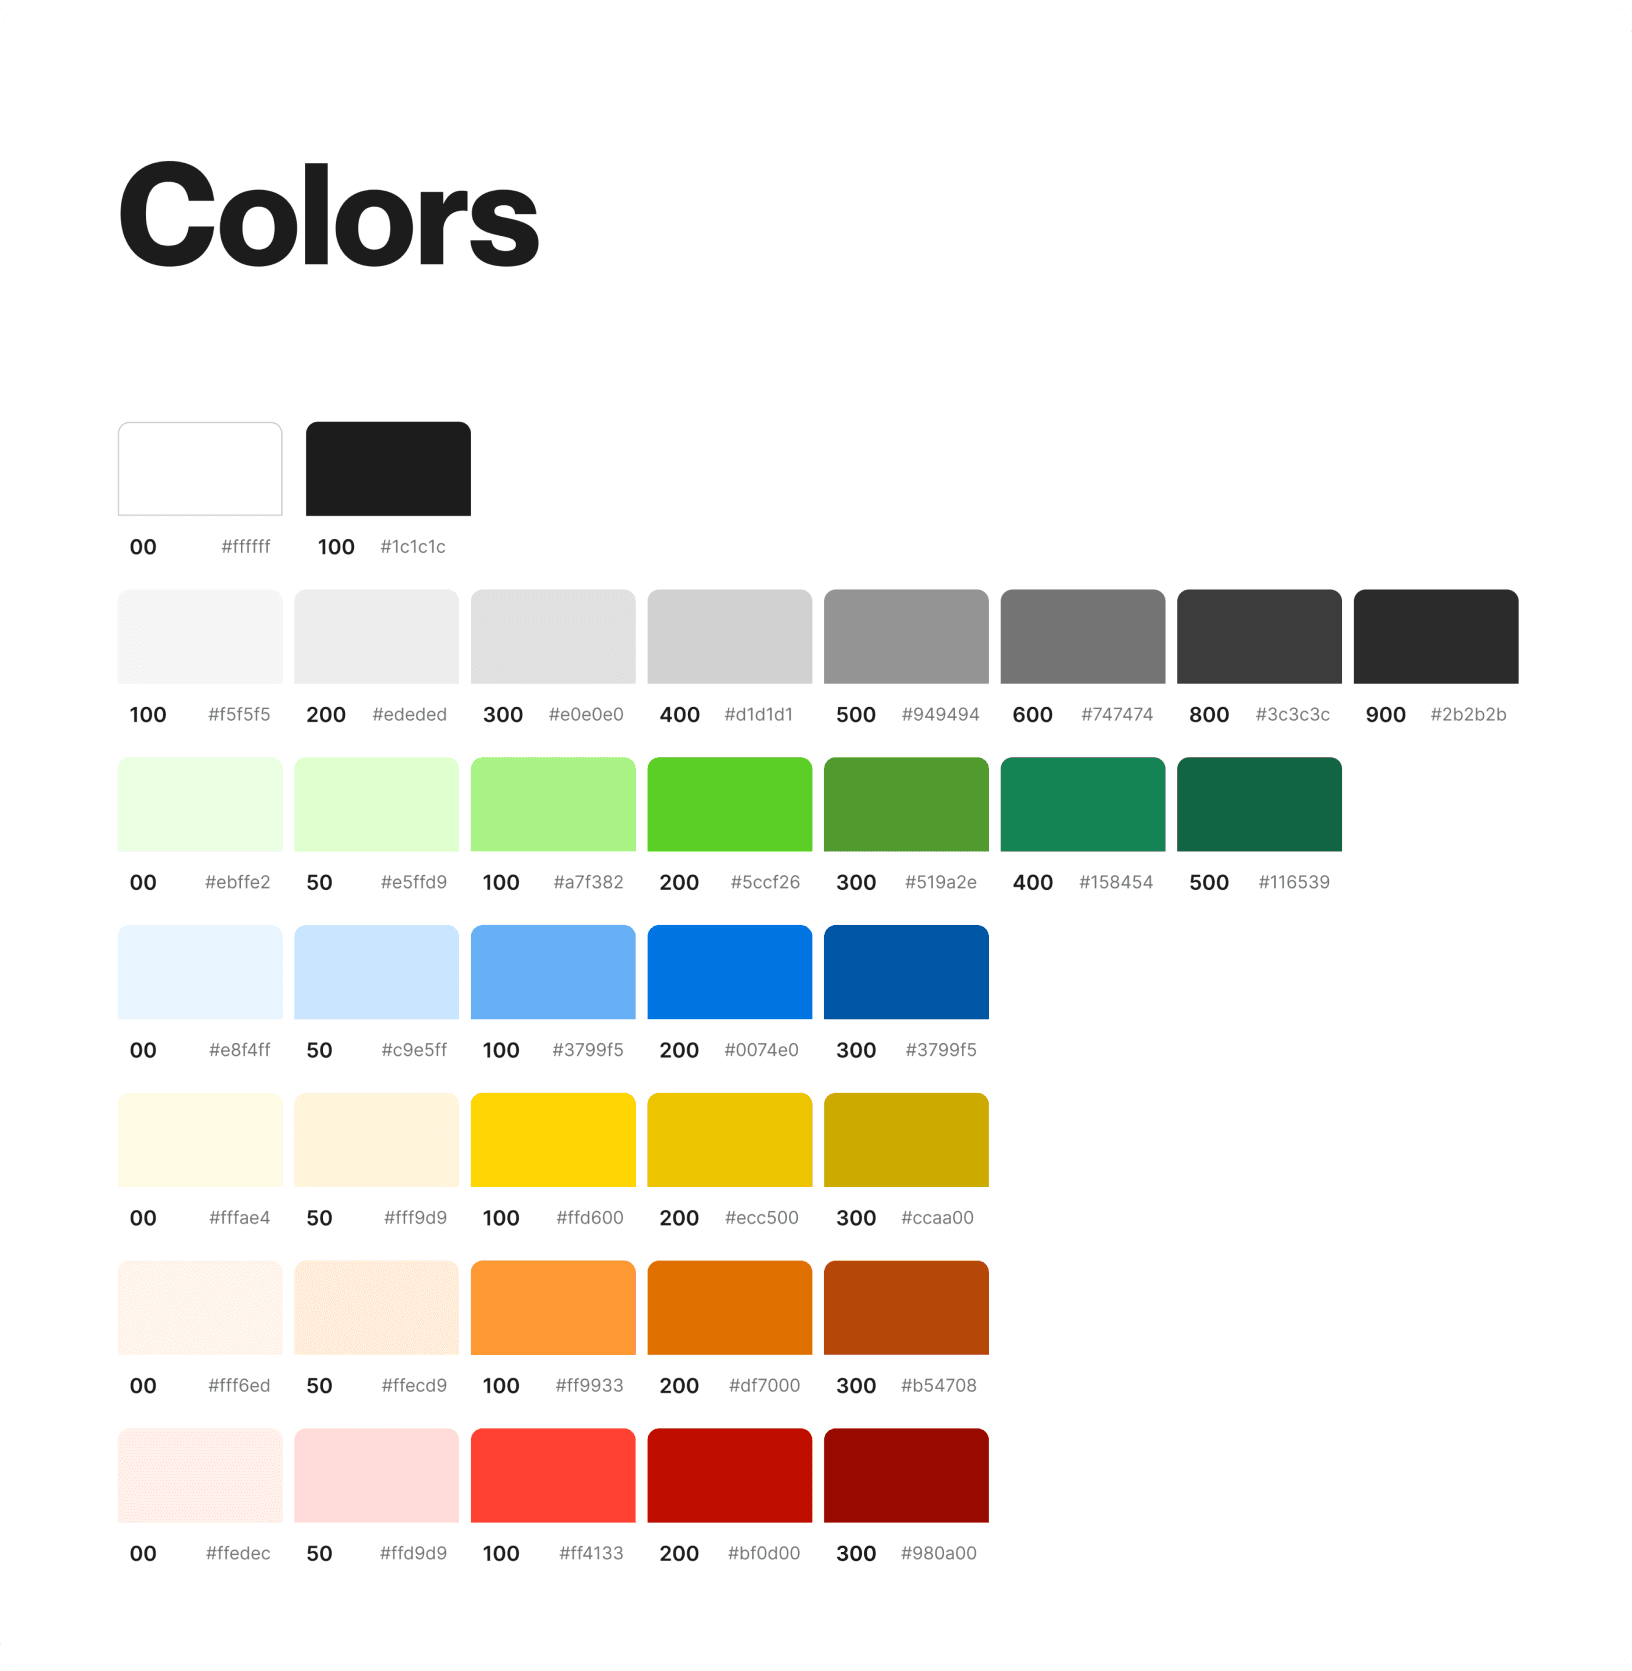
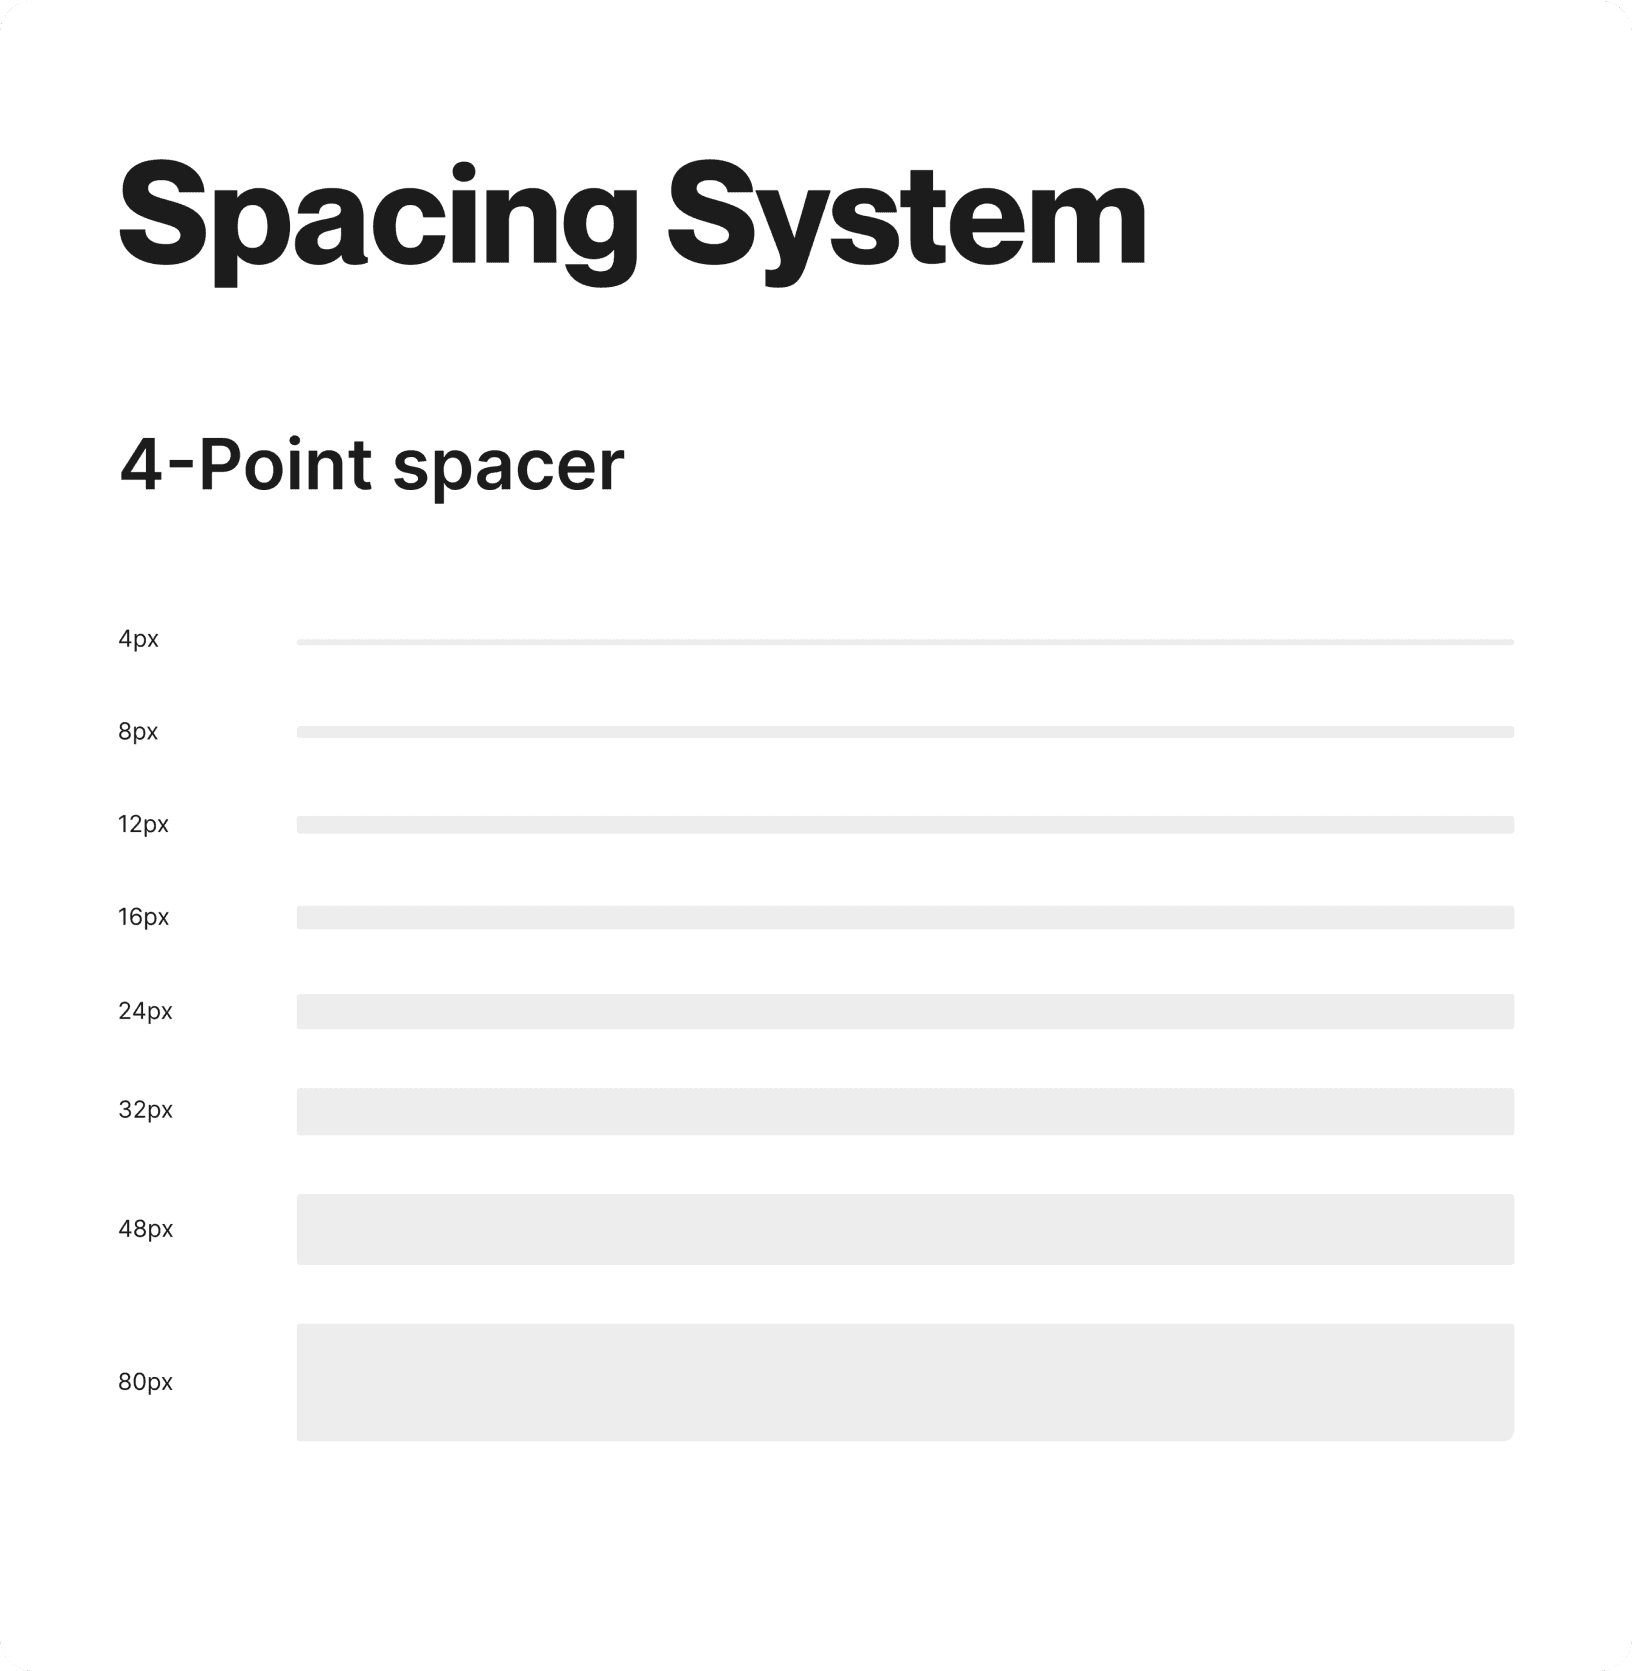
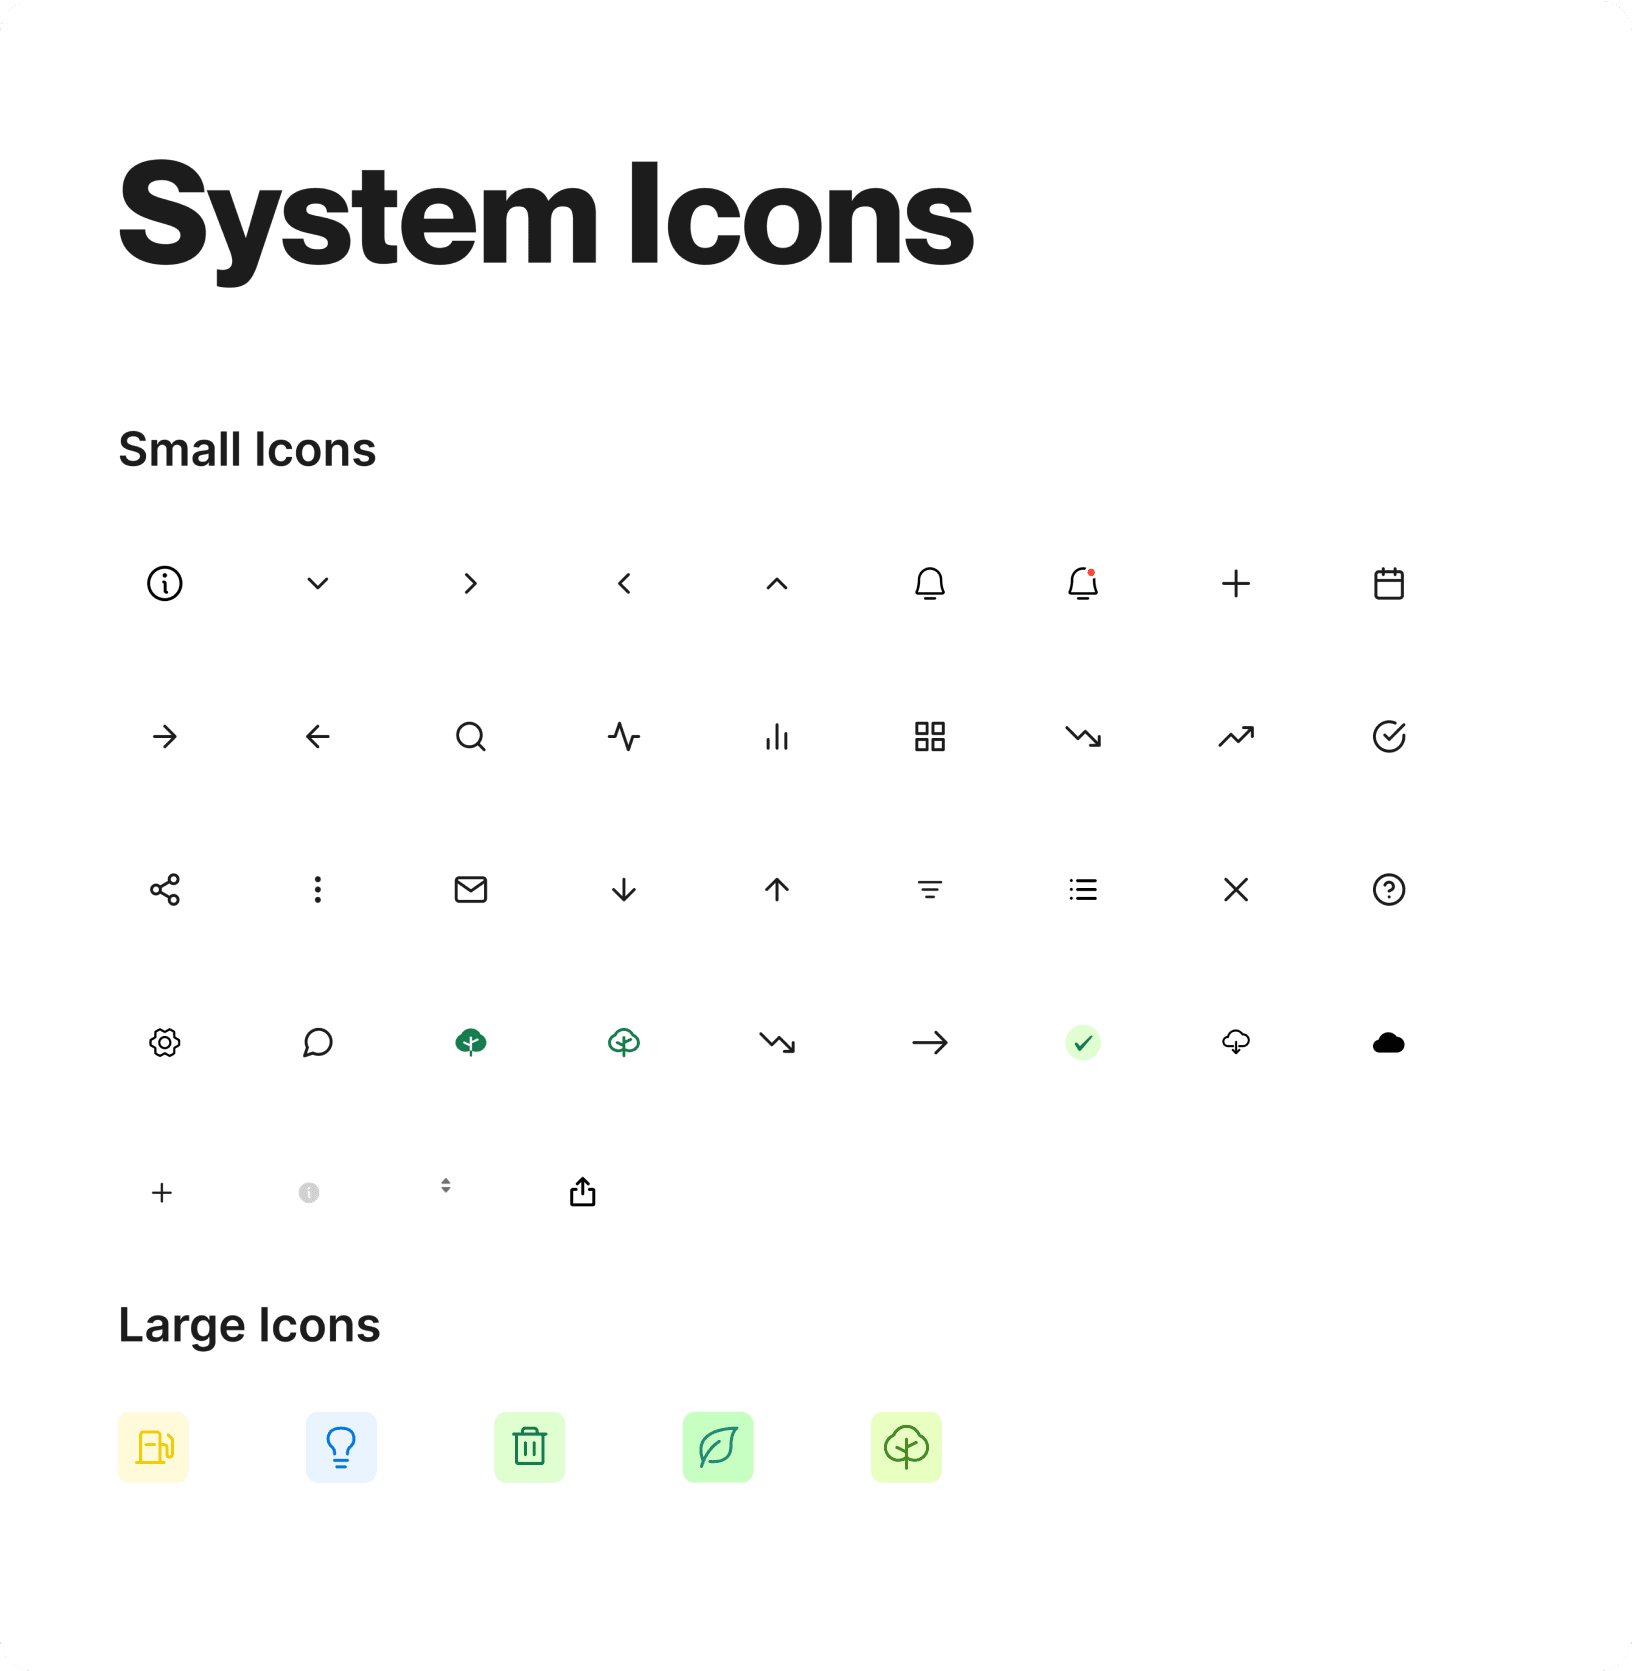
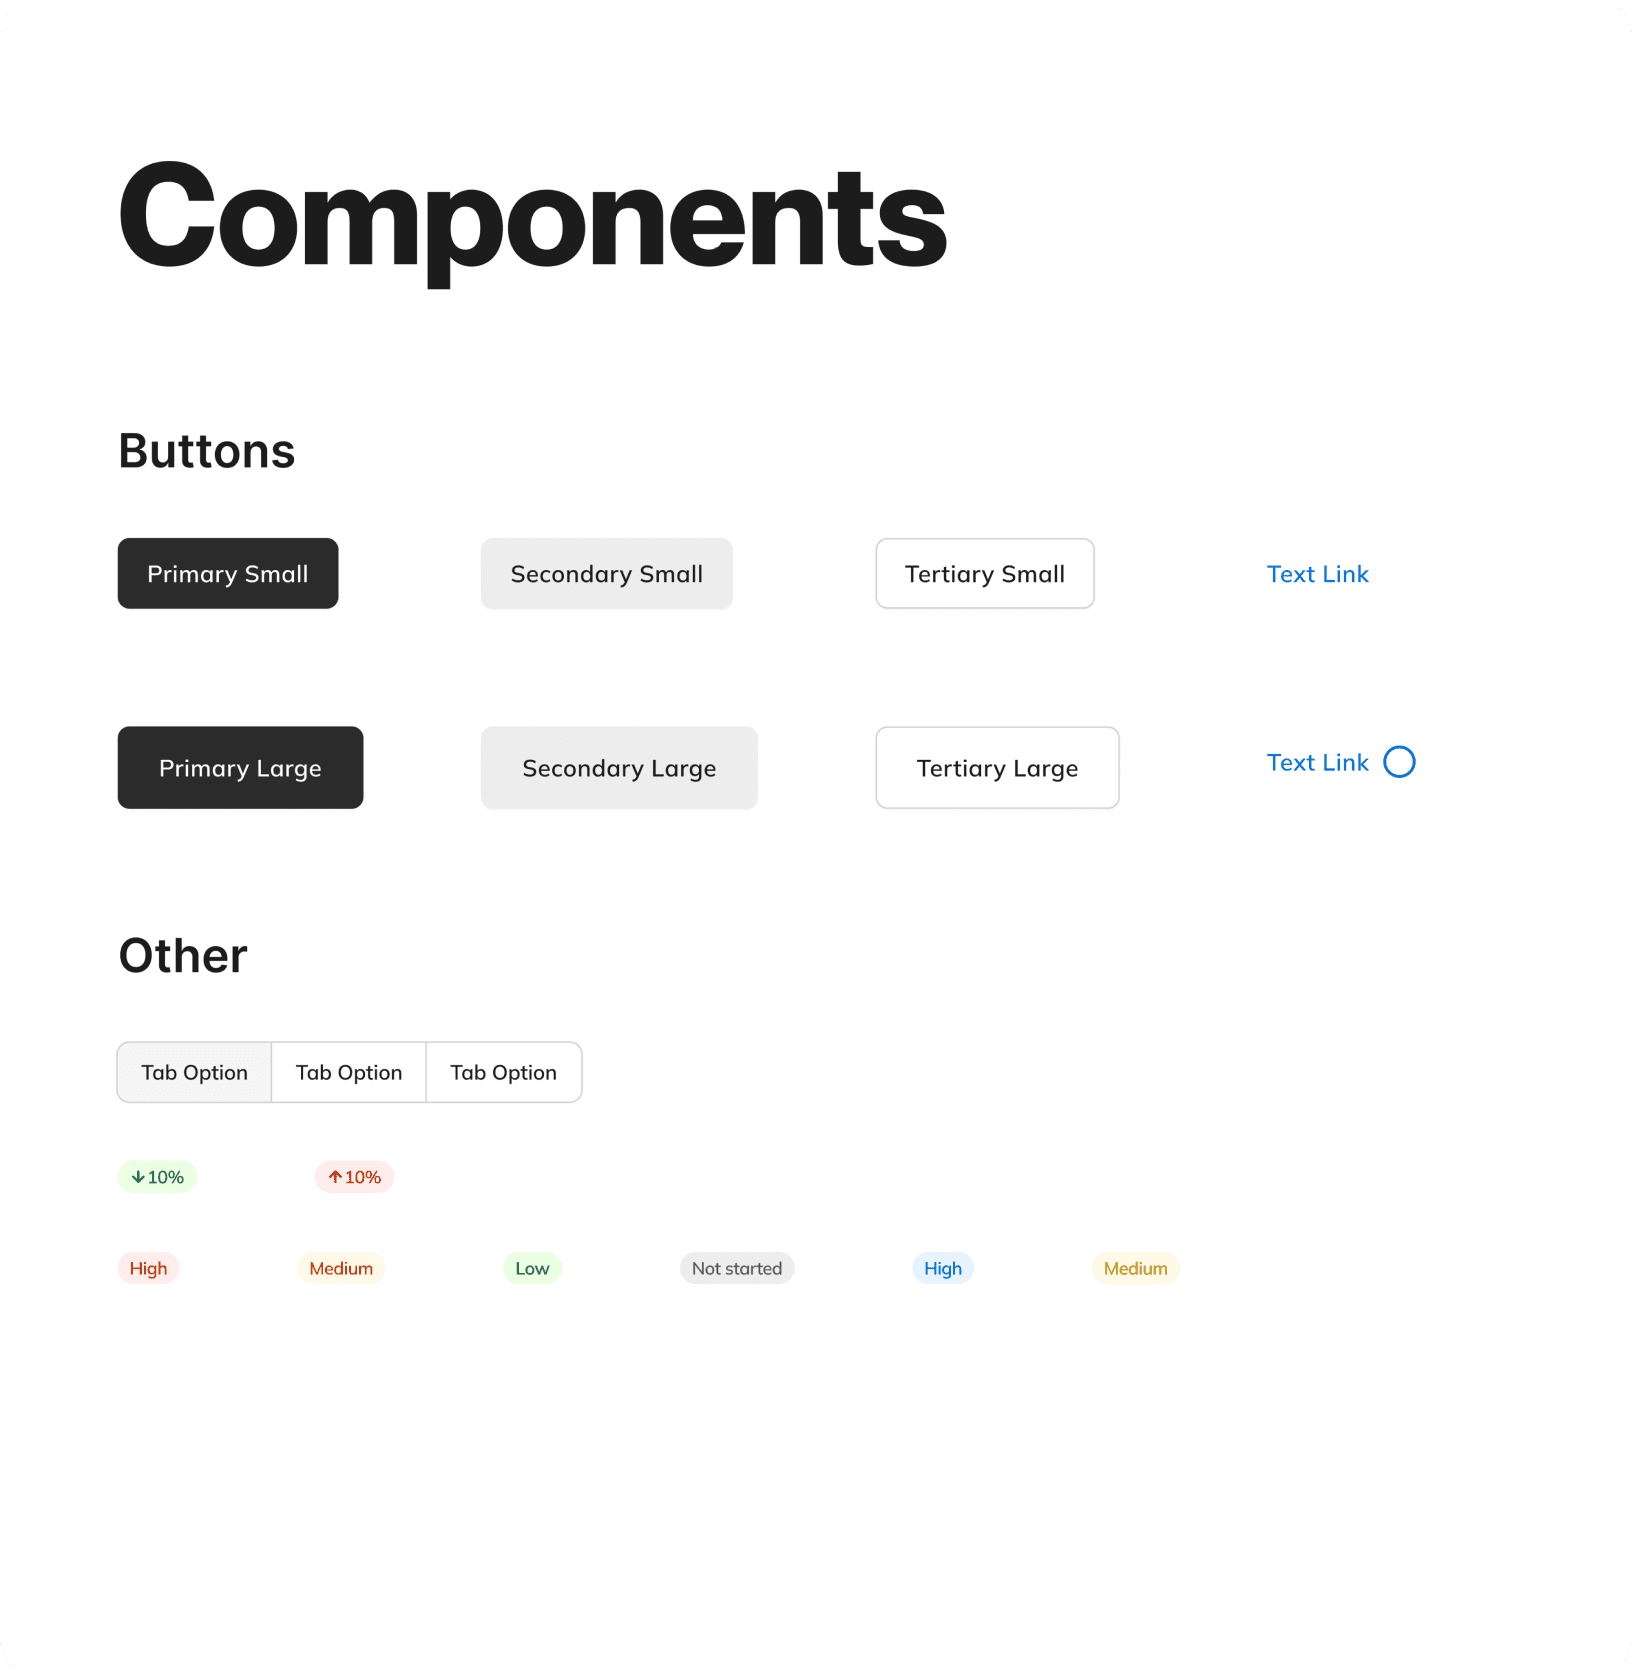
Using ClimaTech’s brand color as a starting off point, I selected a color scheme and typography style. To create visual interest, I added a couple different shades to the primary green pallet.
I chose a typography style that had clarity, organic shapes, and consistent, monospaced numbers.


final designs
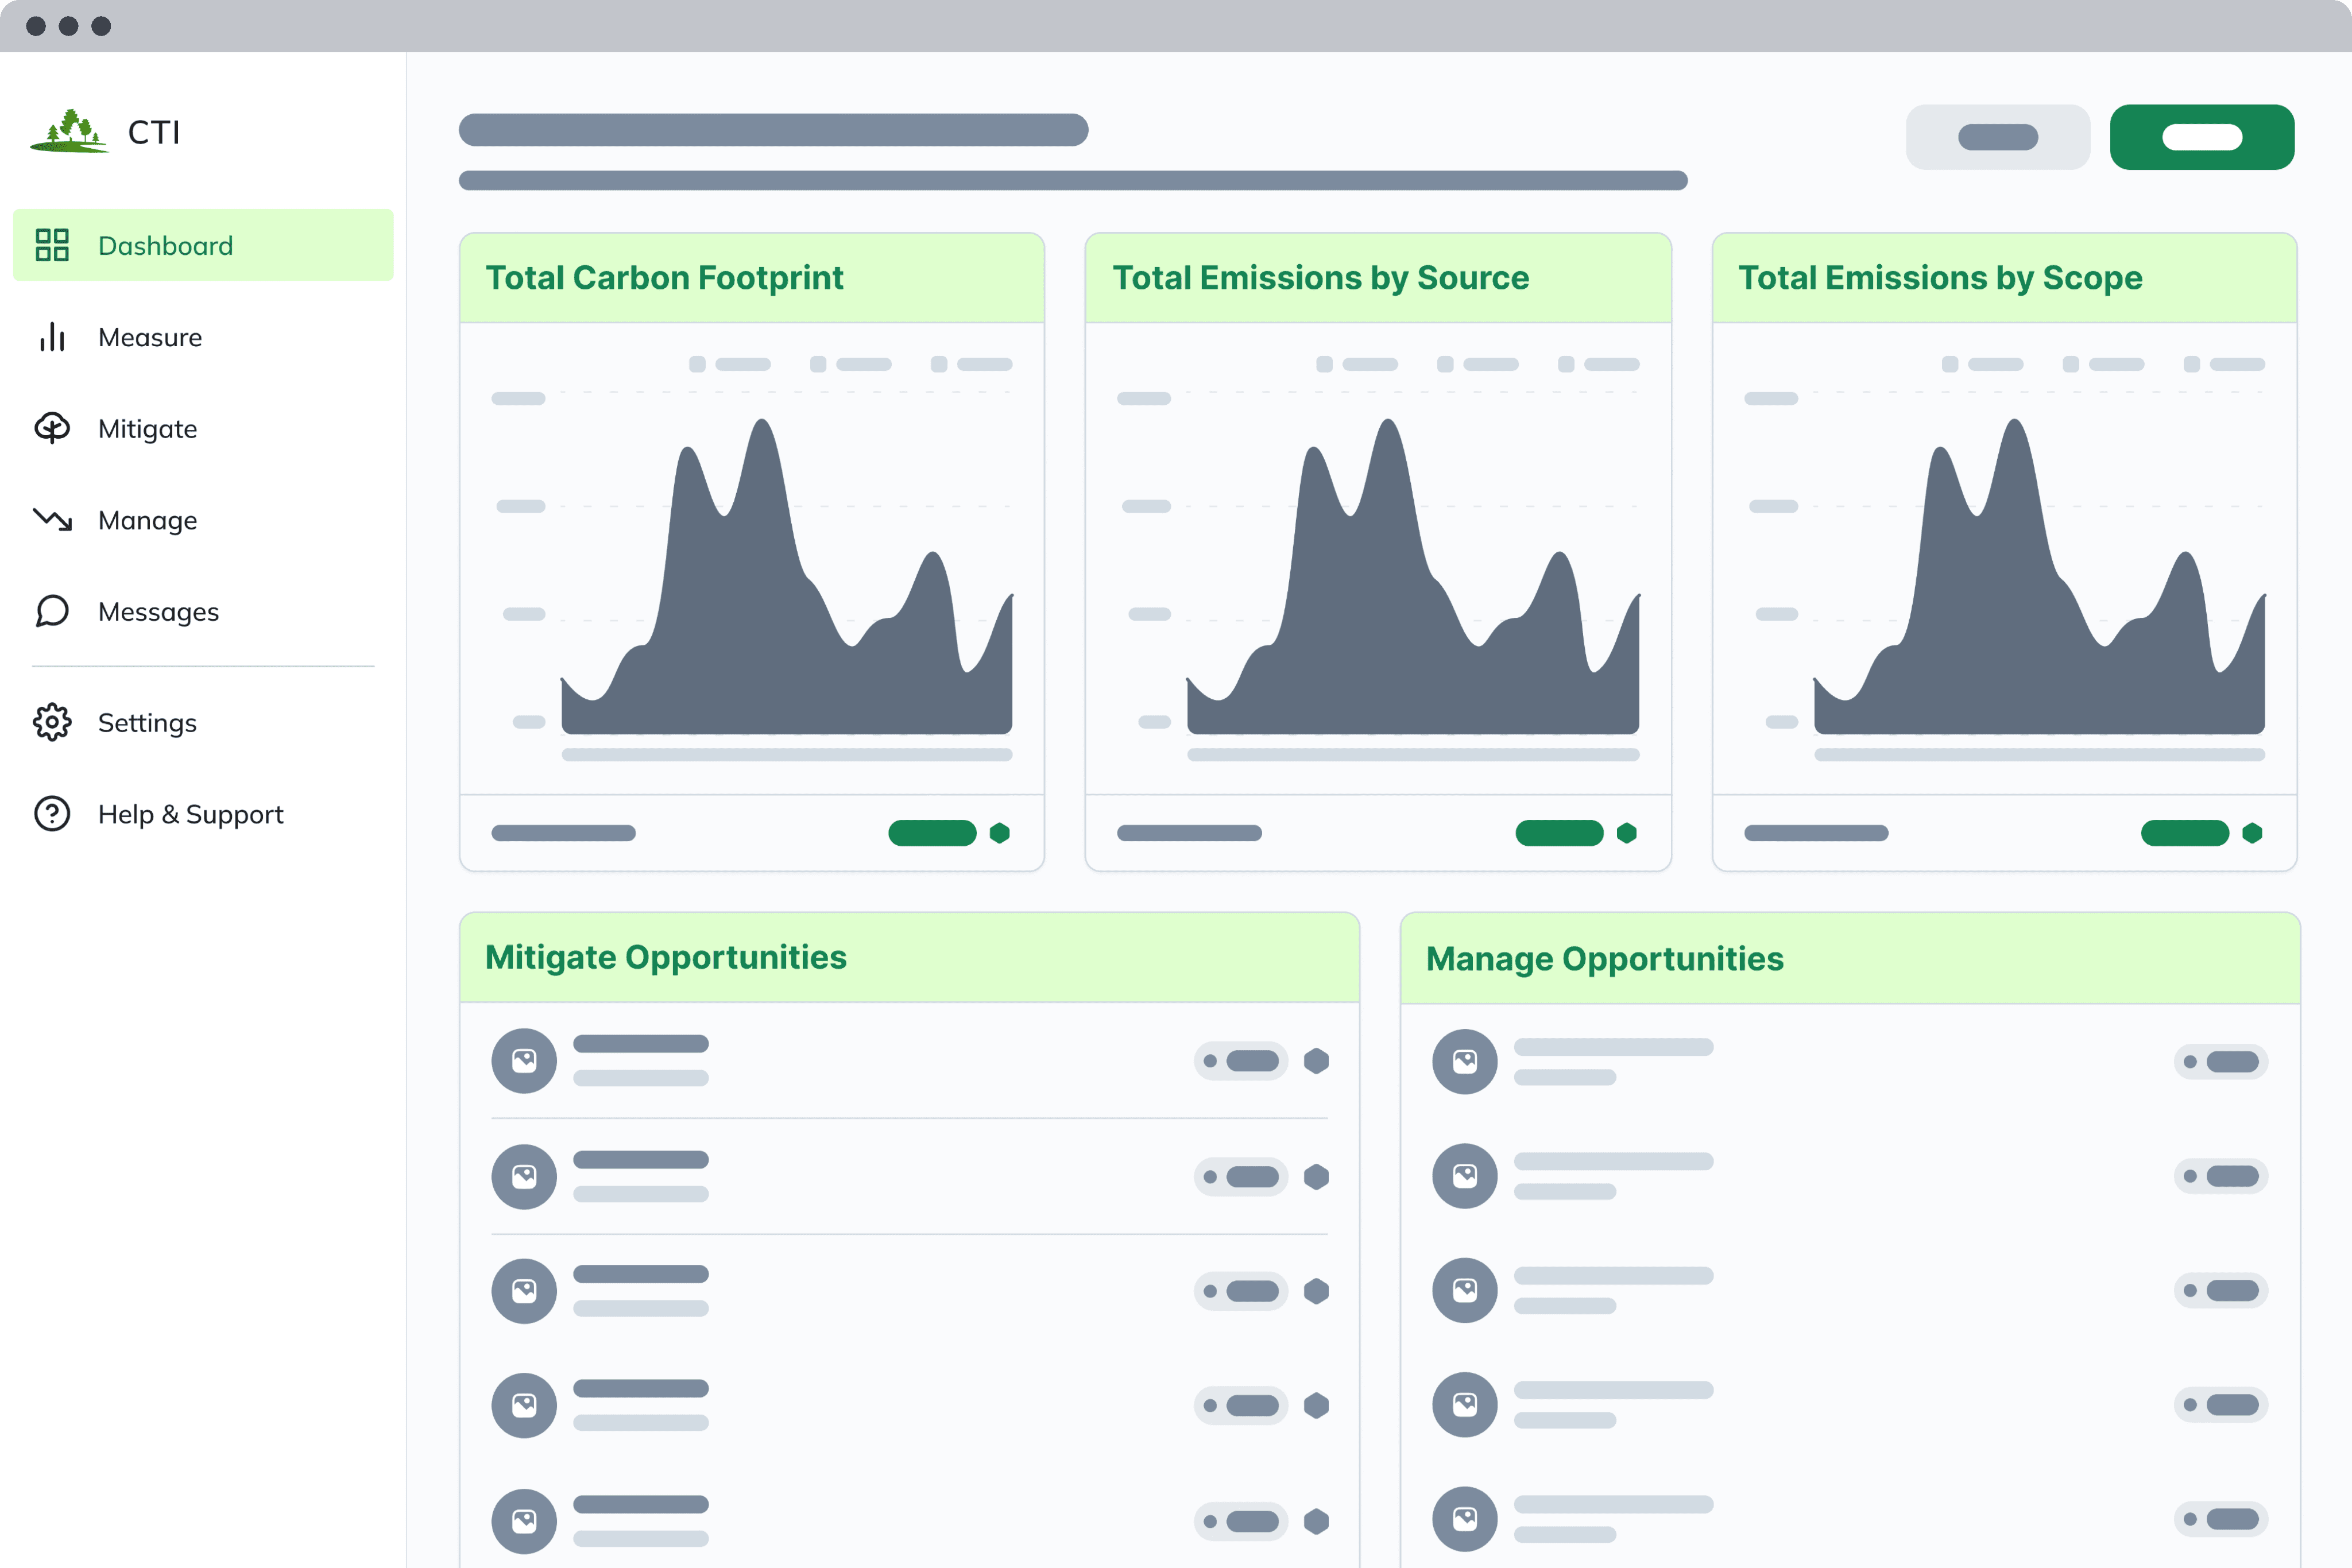
User Dashboard
Overview of company’s total carbon footprint
Recommendations for offsetting and reducing carbon emissions
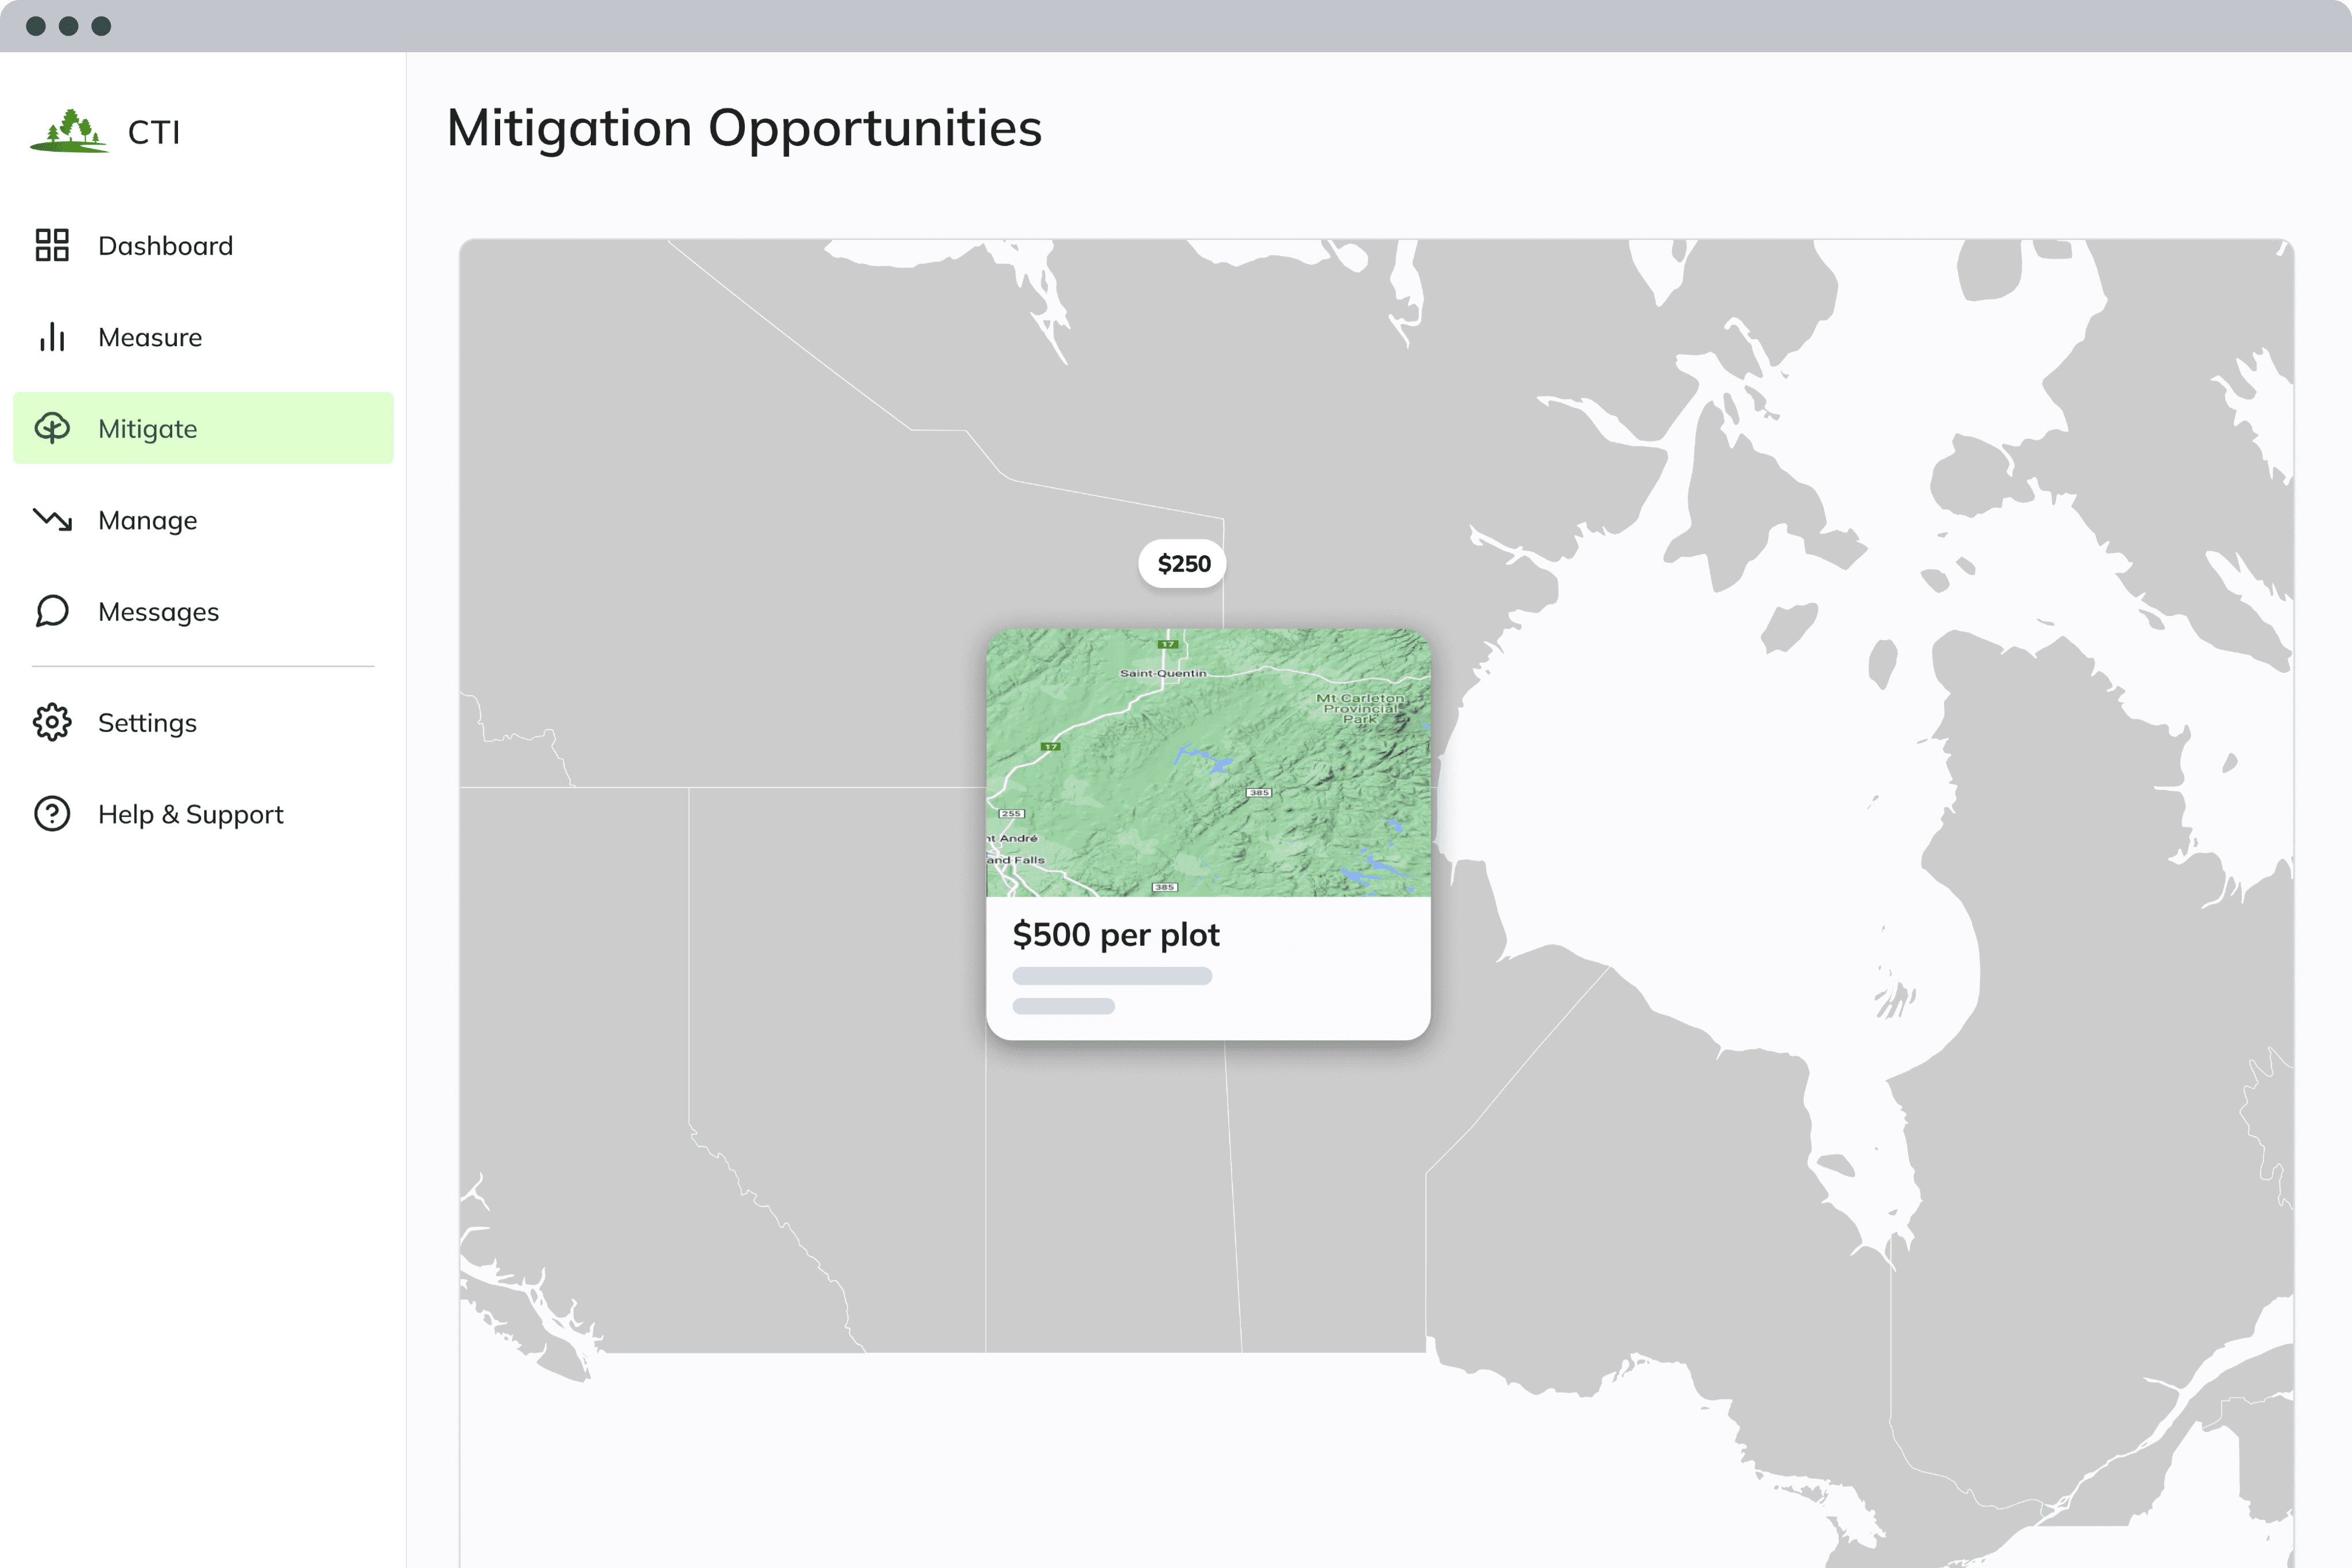
Mitigate Page
Users can offset their company’s carbon footprint by purchase plots of land from ClimaTech
Once land is bought, the company's signage is put on the trails. Allowing users to search and select plots near their business means they can visit the land they have bought

Manage - Recommendations
Users are shown options for reducing their carbon footprint
Users can select options based on the amount it will reduce their total carbon footprint (tCO2), cost, and return on investment (ROI).
Modal gives detailed information on the recommended reduction actions, including recommended vendors to go through to implement a specific change.

Measure Page
Page includes additional charts, breaking down the company’s carbon footprint by different metrics.
Interested users can see a more in depth view of their company’s carbon footprint.
takeaways
I believe that limiting the scope to the foundational pages, gave me time to create fully thought out designs that helped us communicate to ClimaTech our vision for the full SaaS solution.
If I had a little more time…
Combine all options for reducing the company's CO2 into one chart.
If I had a little more time, I would revisit the main dashboard page. I was exploring the possibility of combining the Mitigate and Manage sections into one table that would not only give users top recommendations for reducing or offsetting carbon emissions, but would compare those options side by side, instead of as two categories. I would have been interested in testing this idea with users.

what's next
Using these core pages along with the Style Guide, ClimaTech can build additional pages needed for their complete SaaS offering.
ClimaTech will use the MVP as a preview to the full digital Carbon Accounting SaaS solution to attract potential clients.


